
 Once you begin to understand technical analysis, you’re literally looking at a consolidated view of the very forces of supply and demand – the two key forces that drive stocks.
We’ve already discussed some of the most powerful and most used patterns, like Bollinger Bands, Fibonacci retracements, relative strength, head and shoulder patterns, breakouts, and even how to use candlesticks.
And we’ll show you even more, including the flag and pennant patterns right now.
But I want you to keep one thing in mind with all of these – never use any as a standalone indicator. Always seek confirmation of potential shifts.
That’s an essential part of your success as a technical trader.
The Bull and Bear Flag Formations
Typically, a flag will show up when the price of a stock moves up (bull) or down (bear) in a strong trend, but then pauses, handing you another potential buying opportunity.
The price of the stock will then trade sideways in a narrow, sometimes sloping range. Drawn trend lines can help illustrate support and resistance, as the stock is narrowing will form a rectangular shape – much with the look of a flag.
Eventually, the price will break out of the flag pattern and continue the original paused trend.
As with most patterns, there is a bullish and bearish version.
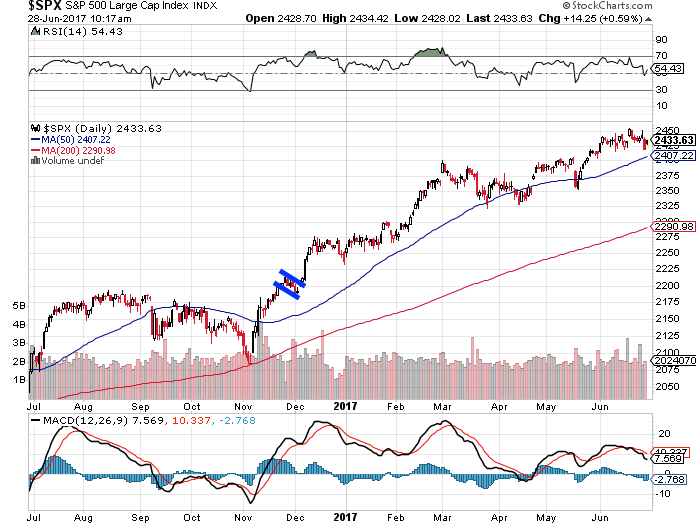
With a bullish flag, you’ll notice the flag sloped down slightly after an incredible move higher. One of the reasons you want to seek confirmation before buying a bull flag pattern is because it has about 67% success, typically. It can be a potential indication the stock can move higher after finding such a setup.

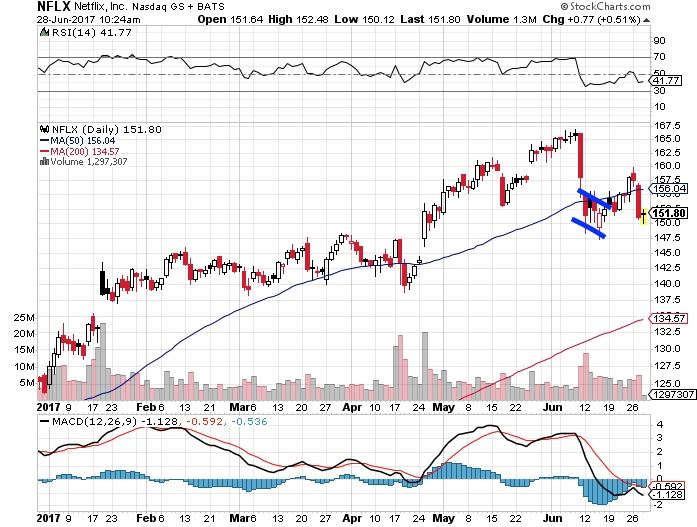
With a bearish flag, you’ll notice the flag sloped up after an incredible move lower. They can be an indication of potential lower lows. These also have a success rate of about 67%, too. So confirmation is best.

As long as you’re willing to confirm with other indicators, you could make good money.
Options Trading Expert Reveals His Strategy…
I want to show you how to trade options like a champion… And inside this guide, I’ll show actual examples of option portfolios that you can follow to get started right away. The key is using leverage… Let me show you how.
Click here to download your free eBook.
The Pennant Formation
The pennant formation will take the shape of a symmetrical triangle, where support and resistance lines begin to converge upon one another. It’s typically a continuation pattern much like the flag formation that follows a large movement in a stock, followed by a brief period of consolidation, creating the pennant look, followed by a breakout movement in the same direction as the previous move.
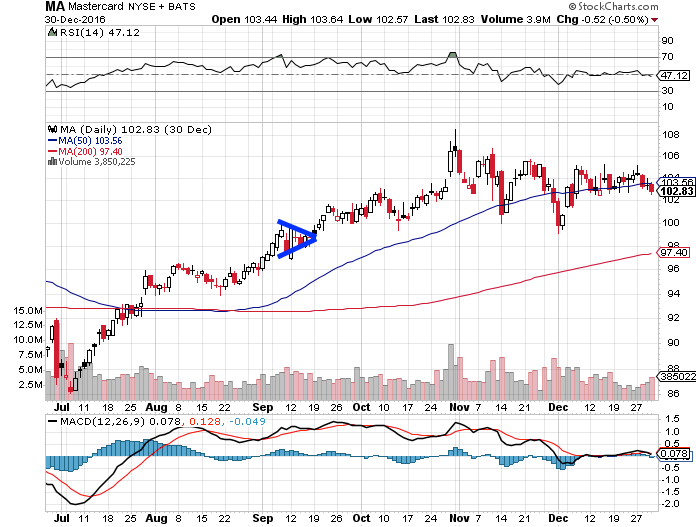

This happens when the stock moves higher in the shape of a flagpole, and then trades sideways into a narrow range. The result looks like a pennant hanging on a pole, according to CNBC.
While not always easy to spot at first glance, they’re still very useful.